Meter Definition
Amberflo provides a comprehensive set of Meter Types that allow for the tracking and aggregation of any resource. We aim to provide a flexible set of options for the frequency and method of reporting (usage events).
At a high level, we have separated the meter creation process into three stages. In the first, we will configure the use case. This includes the use case of the meter event (usage or seat-based) and the scenario to aggregate metering events. In the second step, we will configure the event payload and dimensions. In the last step, we will configure the meter details such as name and description.
Amberflo Cloud Metering Service automatically collects, persists, and aggregates the meter data in real-time. Meters are defined based on the Use Case,Scenario, and the Event Type that are selected as shown in the meter list view below.
Usage-based Meters
Usage-based meters track how much your customers consume from a resource. It has two Scenarios and two Event Types to choose from.
Scenarios
Usage-based scenarios (sum or average), are used to apply functions on the the events that are ingested into Amberflo.
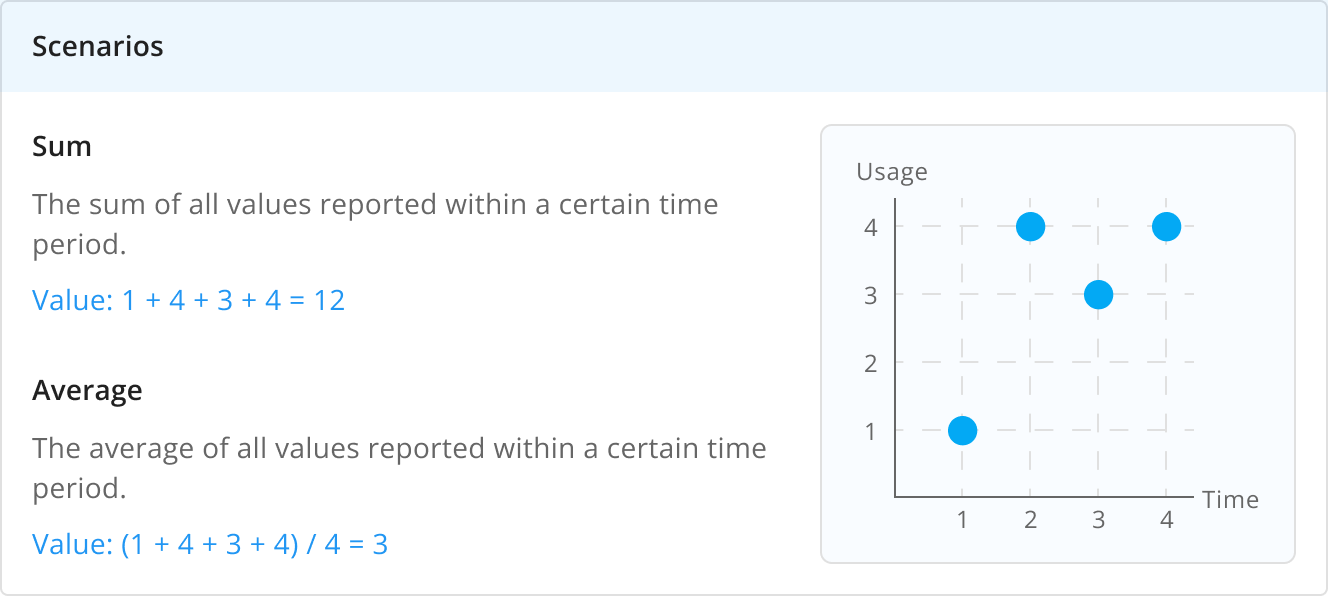
Sum Scenario
The sum function will aggregate the total of all resources metered in a time period. Let's suppose 1,000 API calls were metered in the first hour, and 2,000 API calls in the second hour. Then, the metered value for this time frame will be the total of the values reported, so 3,000 API Calls.
Average Scenario
The aggregate function will aggregate the hourly average of all resources metered in a time period. Let's suppose 1,000 API calls were metered in the first hour, and 2,000 API calls in the second hour. Then, the metered value for this time frame will be the average of the hours reported, so 1,500 API Calls.
Event Types
Usage-based meters have two event types to choose from: Count or Continuous. The event type determines the way Amberflo interprets the events you ingest.
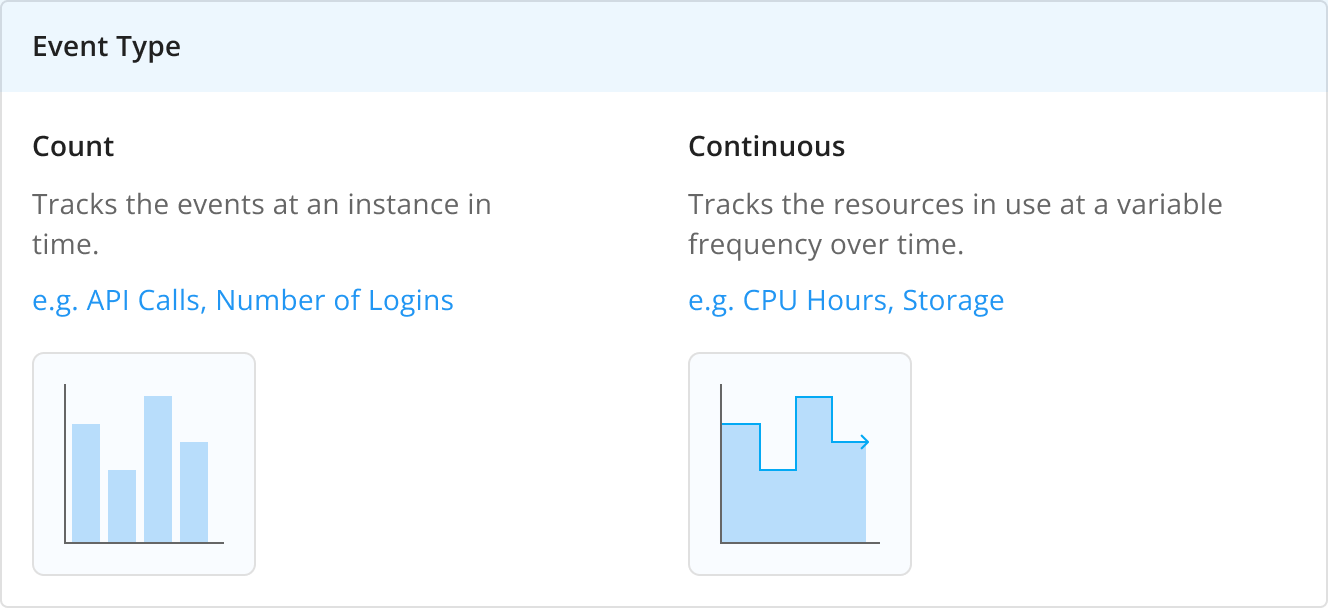
Count Meters
Count meters track the number of times that a completed action has taken place. Example resources tracked by this meter type include API calls, read calls, button clicks, and active user tracking.
Event Pipeline - Fresh vs. Non-fresh
Choosing the Fresh option will aggregate the meter events in the metering and billing dashboards in real-time, while the non-fresh option will have a 3-hour delay.
Continuous Meters
Continuous meters track the usage rate or scale of ongoing usage that takes place over time. To calculate true usage from the usage rate, one must calculate the integral/area under the curve that shows the usage rate over time. Example resources tracked by this meter type include data storage and VM runtime.
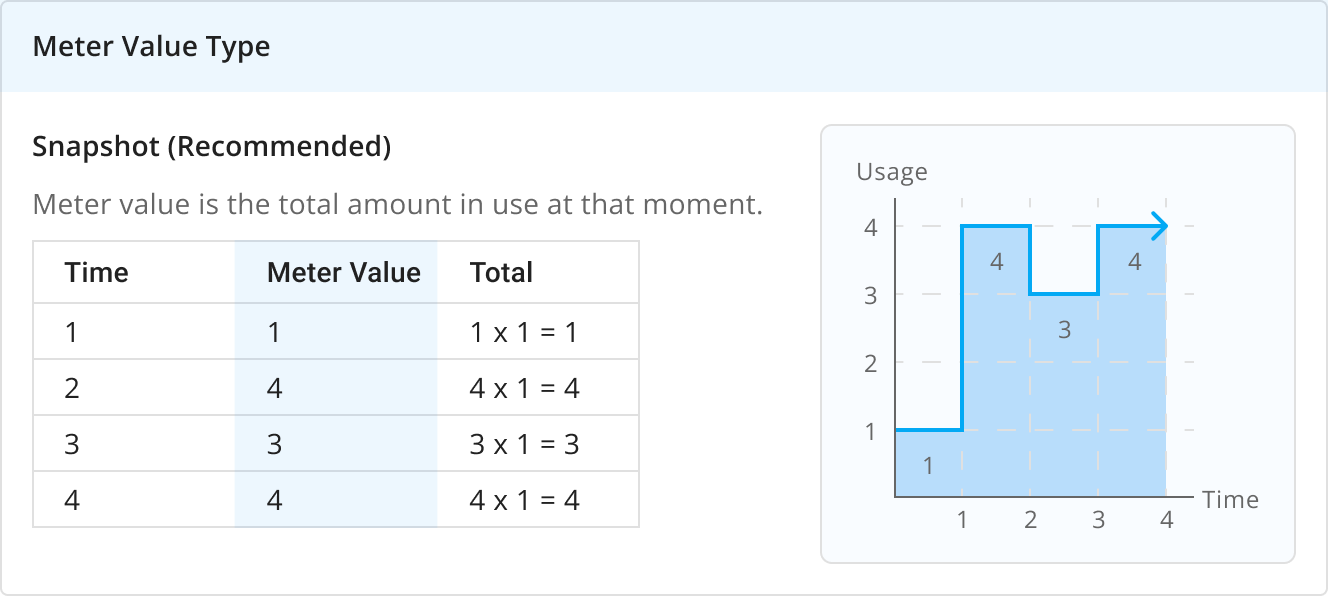
Meter Value - Snapshot vs. Delta
Reporting meter values as Snapshot is the recommended practice. Using this approach, the meter value is equal to the total usage rate at that time.
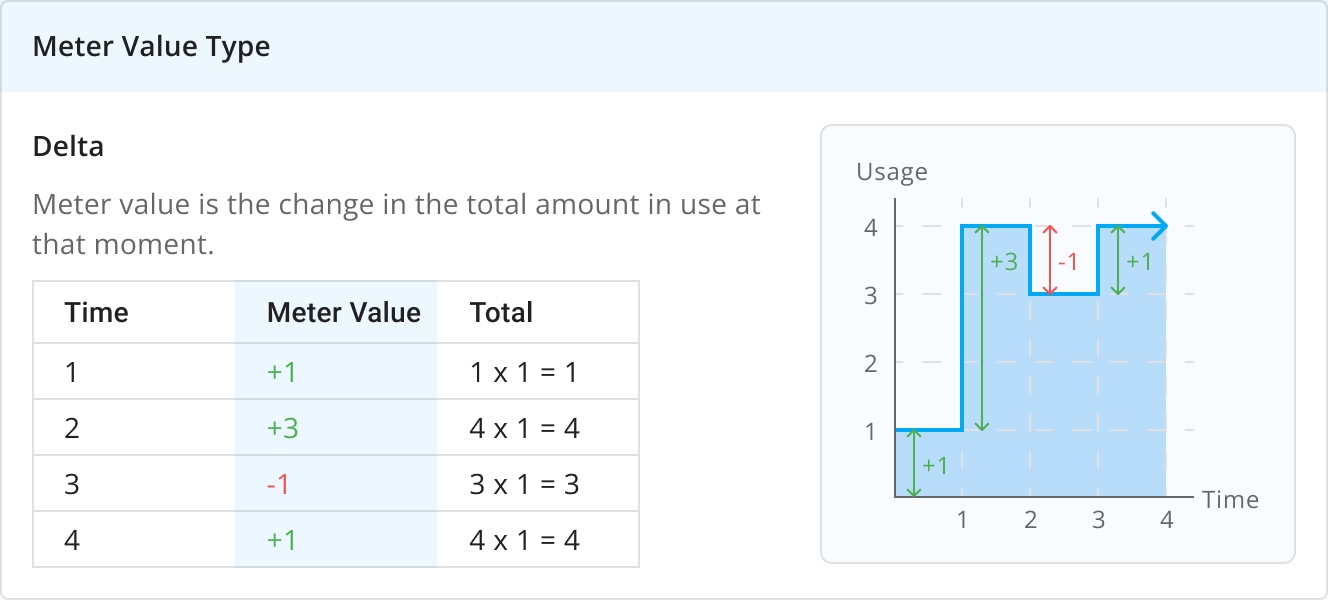
When using the Delta approach, the meter value is equal to the difference between the previous usage rate and the current usage rate. Said another way, it is the magnitude of the change from the previous event to the current time.
Building Blocks of the Continuous Meters
There are some configurations that are only applicable to continuous meter types.
Unique ID Dimensions
These dimensions are unique identifiers that can be used to associate events with, for example. a specific user or a resource. Multiple dimensions can be added to form a composite key.
If your continuous meter is tracking, for example, server usage, then this field would most likely be serverID.
Timeout
The default maximum duration for an event. If an end event is not sent to Amberflo before the timeout period expires, the meter will stop automatically.
Use Cases
Meter reports a value of 1 when a compute instance is started and a value of 0 when a compute instance is shut down. Get the duration of how long the VM was running in hours.
Other examples: workflow lifetime, task duration, help desk turnaround time, function duration.
Example Calculation
Given:
- Meter Definition created with
- name = ComputeInstances
- eventIdDimension = clusterId
- timeout (max duration) = 4 hours
When the following events are created:
- <time(day 1, 1:10), meterName(ComputeInstances), customer(ENCOM), clusterId(1), value(1)>
- <time(day 1, 1:15), meterName(ComputeInstances), customer(ENCOM), clusterId(2), value(1)>
- <time(day 1, 1:45), meterName(ComputeInstances), customer(ENCOM), clusterId(2), value(0)>
- <time(day 1, 1:55), meterName(ComputeInstances), customer(ENCOM), clusterId(1), value(0)>
- <time(day 2, 1:00), meterName(ComputeInstances), customer(Stark Industries), clusterId(1), value(1)>
- <time(day 2, 9:00), meterName(ComputeInstances), customer(Stark Industries), clusterId(1), value(0)>
- <time(day 3, 1:15), meterName(ComputeInstances), customer(ENCOM), clusterId(4), value(1)>
- <time(day 3, 3:45), meterName(ComputeInstances), customer(ENCOM), clusterId(4), value(0)>
- <time(day 4, 23:30), meterName(ComputeInstances), customer(ENCOM), clusterId(5), value(1)>
Then, with Sum scenario:
- Query range of day 1 to day 1 -> value 1.25
- Query range of day 2 to day 2 -> value 4 # timeout exceeded
- Query range of day 3 to day 3 -> value 2.5
- Query range of day 1 to day 3 -> value ENCOM(5.25), Stark Industries(2.5)
- Query range of day 4 to day 4 -> value 0.5
- Query range of day 5 to day 5 -> value 3.5 # carried over from day 4 and timed out
Seat-based Meters
Seat-based meters track the number of seats, in other words, the number of active objects such as users, licenses, and files, the customer is using. It has three Scenarios to choose from.
Scenarios
Seat-based scenarios are used to configure where the uniqueness calculation for meter events will occur (metering or billing dashboard), and the frequency of this calculation.
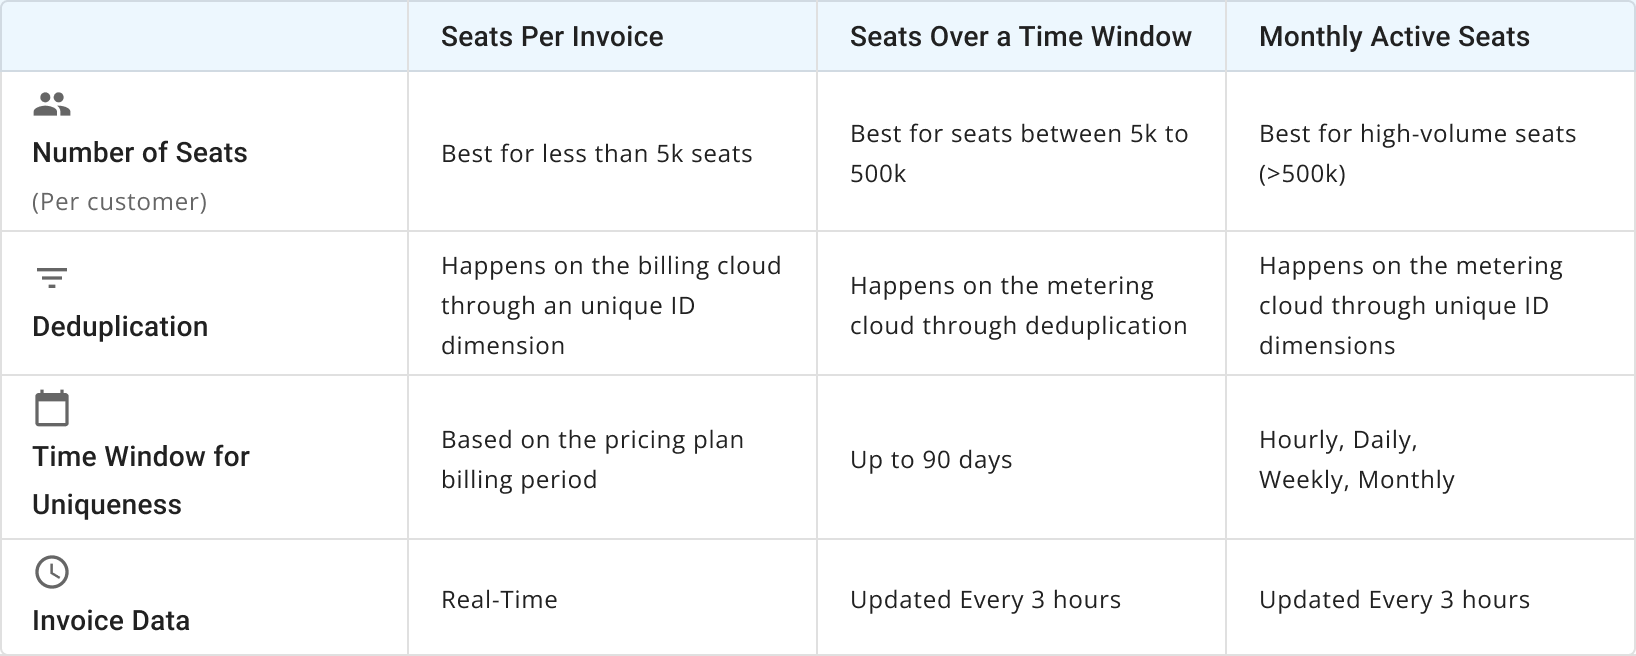
Seats Per Invoice Scenario
Seats per Invoice meters are best used for tracking a low number of seats (less than 5K seats). The biggest advantage of these meters is that the uniqueness calculation for meter events occurs on the billing cloud. This means that you can choose to have a different Unique ID dimension for this calculation in different pricing plans for the same meter.
The only configuration for this meter scenario is to declare dimensions, which can then be set as the Unique ID dimension on the product item rates.
Product Item Rates for Seats Per Invoice Meters
When the Seat-based product item rate is selected in a pricing plan with a Seats Per Invoice meter, the configurations needed are as follows:
- Unique ID Dimension: This will be the dimension for the uniqueness calculation over the ingested meter events. If the Unique ID dimension is
userID, then the billable amount will be the unique values of theuserIDdimension over the ingested meter events in the selected time range. - Time Period: You can choose to calculate unique values of the selected Unique ID dimension over the billing period of the pricing plan, daily, or hourly.
Seats Over a Time Period Scenario
Seats Over a Time Period meters are best used to track medium cardinality seats (between 5K and 500K seats). The biggest advantage of this meter scenario is having control over the time frame of the uniqueness calculation and selecting which dimensions are used to deduplicate events.
Unlike the other two scenarios, these meters can do uniqueness on any set number of days up to 90 days, and deduplicate events based on a group of dimensions. The meter events will be deduplicated on the metering cloud side, meaning that when the events are rated in the billing cloud, we would already only have the unique events.
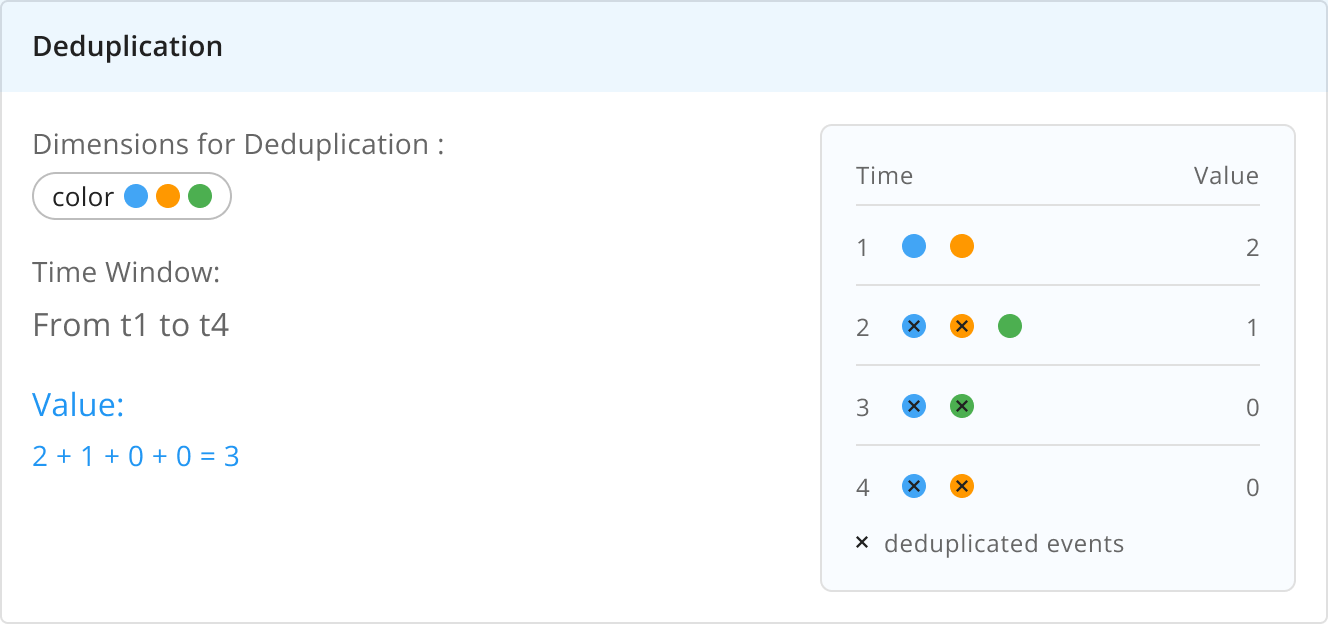
Deduplication Mechanism
Seats Over a Time Period meters work with deduplicating ingested meters events first before sending them to the billing cloud for rating. There are two configurations needed for the deduplication mechanism:
- Dimensions: You can choose a group of dimensions for the deduplication mechanism. These will be used to check if an ingested event's dimension values are the same as an old event within the selected time period, and if so, the event will be deduplicated.
- Time Period: This configuration sets the number of days to check if an old event is the same as the newly ingested event in terms of the selected dimensions.
For example, we set userID and documentID to be two dimensions selected for the deduplication mechanism and the time period is 5 days. We just ingested an event with the following dimensions payload:
{ "dimensions: { "userID": "userID_1", "documentID": "documentID_1" } }
The deduplication mechanism will check if a past event within the 5 days of the event timestamp was ingested with the same dimensions payload. If so, the new event will be deduplicated.
Product Item Rates for Seats Over a Time Period Meters
Setting up a Seat-based product item rate with a Seats Per Invoice meter is fairly simple. As we are deduplicating the events on the metering cloud side already, the events that arrive in the billing cloud are already unique. So all you have to do is configure the rates for these unique events.
Monthly Active Seats Scenario
Monthly Active Seats meters are best for high cardinality seats (more than 500K seats). The biggest advantage of this meter is that it can support a high number of seats and meter events, and the unique calculations are made each hour, day, week, and month.
Unique ID Dimension(s)
These dimensions are unique identifiers that can be used to associate events with seats. Multiple dimensions can be added to form a composite key.
The Monthly Active Seats will calculate the number of unique occurrences of these dimensions' combinations on each hour, day, week, and month.
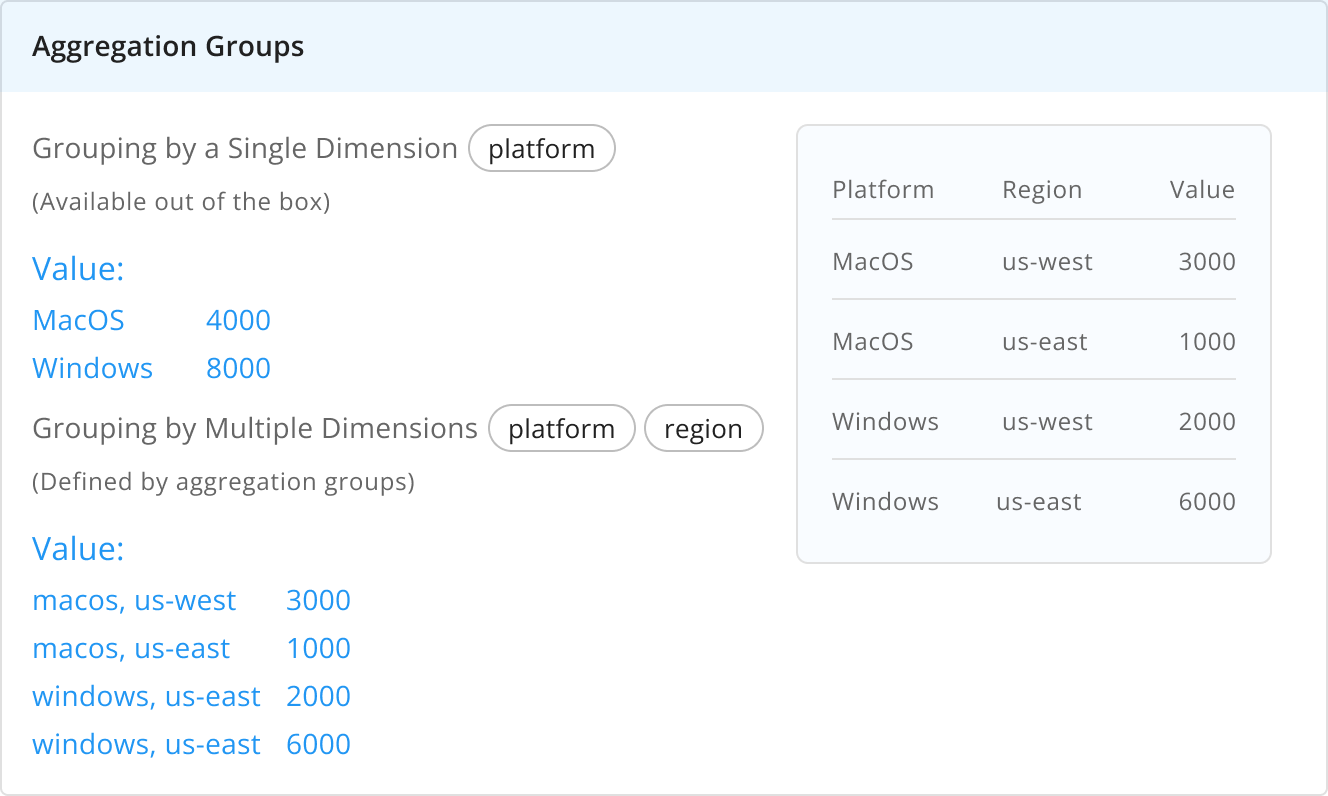
Aggregation Groups
As the Monthly Active Seats meters support a very high cardinality of seats, Amberflo doesn't aggregate all dimension combinations out of the box. Instead, the users declare up to 5 dimension groups to have aggregated on the metering and billing cloud. This means that these dimension groups can be used in Usage APIs as well as used as a dimension table on the product item rates.
Please keep in mind that single dimensions and their combination with the customerId are always available.
Product Item Rates for Monthly Active Seats Meters
When setting up a Seat-based product item rate with a Monthly Active Seats meter, you will just have to choose the time period you want to charge your customers on. Above we mentioned that this meter calculates the unique values over hours, days, weeks, and months. As such, in the pricing plan, you can choose one of these time periods to charge your customers.
If you prefer to go with a Dimensions rate model, then you will also have to choose an aggregation group to form the dimension table. Amberflo doesn't have all the dimension combinations available for this rate table, instead, you have up to 5 groups you created within the meter definition available.
Updated 4 months ago